


It can occur that your VPS experiences a high CPU load if, for example, a lot of traffic goes to your VPS, there is a configuration error in one of the processes or a bug in the software. In this article, we explain how you can investigate the cause of this problem in Linux & Windows.
A good step to start with, regardless of your operating system, is to check your VPS for available updates and restart your VPS after installing any updates.
Also, check the CPU usage as shown in the graph in your control panel. You can see whether the CPU use for your VPS over a period of one or more months is structurally high, or that the usage peaked incidentially. In the latter case, that is often an indication that something is wrong with the configuration (or that you suffer from malware) and not that you necessarily need an upgrade from your VPS.
- We have no access to the configuration of the VPSs of our customers and cannot see the cause of high CPU usage. By following the steps in this article and sharing the information obtained with our support department they can think along with you.
- The CPU graphics in the control panel show up to 100% CPU usage per core. Therefore, with 4 CPU cores, you have a limit of 400%.
Examining CPU load in Linux
To examine the cause of a high CPU load, we recommend using the 'Top' program (counterparts such as htop are also a good choice). Top is a process and resource monitor which is present in all Linux distros (you can regard Top as a command-line counterpart of the Windows Task Manager). In our article on Top, we discuss the use of Top in more detail.
Connect to your VPS via SSH or the VPS console and use the command:
sudo topYou will see an output as in the example below (this is an example of a Plesk VPS).
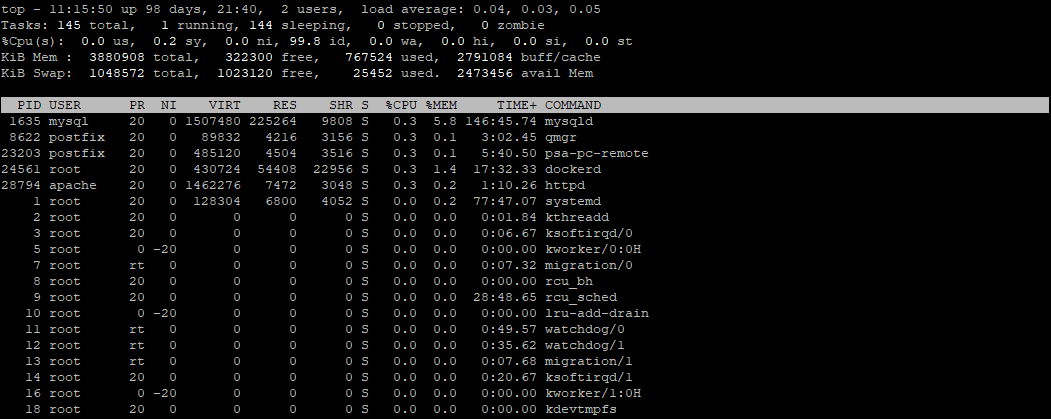
Simultaneously press shift + p on your keyboard to sort the overview by CPU usage. In the %CPU column, you then see which process uses a lot of CPU from top to bottom. The 'Command' column shows the name of the corresponding process (e.g. httpd for Apache). Now go through the following steps to find a possible cause of the high CPU usage:
- View the log files of the relevant process. In this specific example on a Plesk-VPS, you would look for the log files in /var/log/httpd/
- Restart the process which has a high CPU usage. In our example of the Plesk-VPS, you restart the httpd process with:
systemctl restart httpd- Replace 'httpd' with the name of the process with the high CPU load.
- Check the systemd logs for the specific process:
journalctl -xe -u httpd- Here too, replace 'httpd' with the name of the process with the high CPU load. Examine any error messages that you see and restart the process after the problems have been solved (e.g. systemctl restart httpd).
Examining CPU load in Windows Server
If you experience a high CPU load on your Windows Server, it is important to evaluate for yourself if this is an exception, or if the VPS itself is too small. By default, Windows uses many more resources than Linux. You will especially notice this sooner with an X1 or X4.
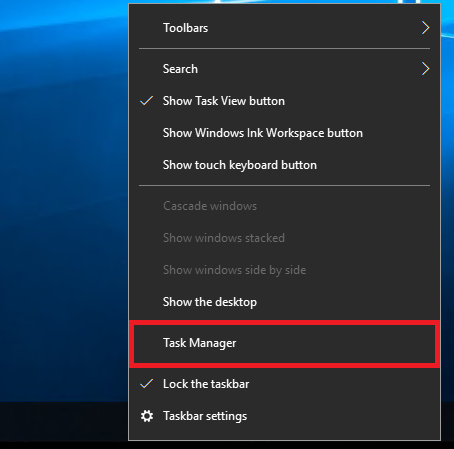
To examine the cause of a high CPU load, we use the Windows Task Manager in Windows Server. You open the Task Manager by clicking the right mouse button on the taskbar (i.e. the bar at the bottom of your screen) and clicking 'Task Manager'.
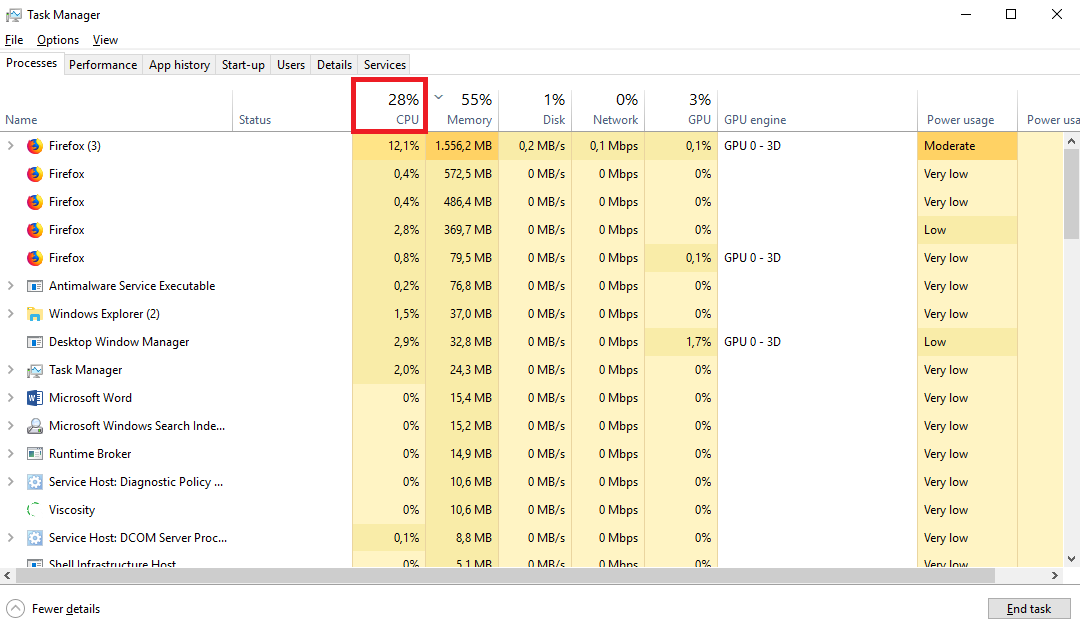
You will see an overview of the active processes. Click 'CPU' to sort the Task Manager by CPU usage. You quickly get an idea of which process causes a high CPU load.
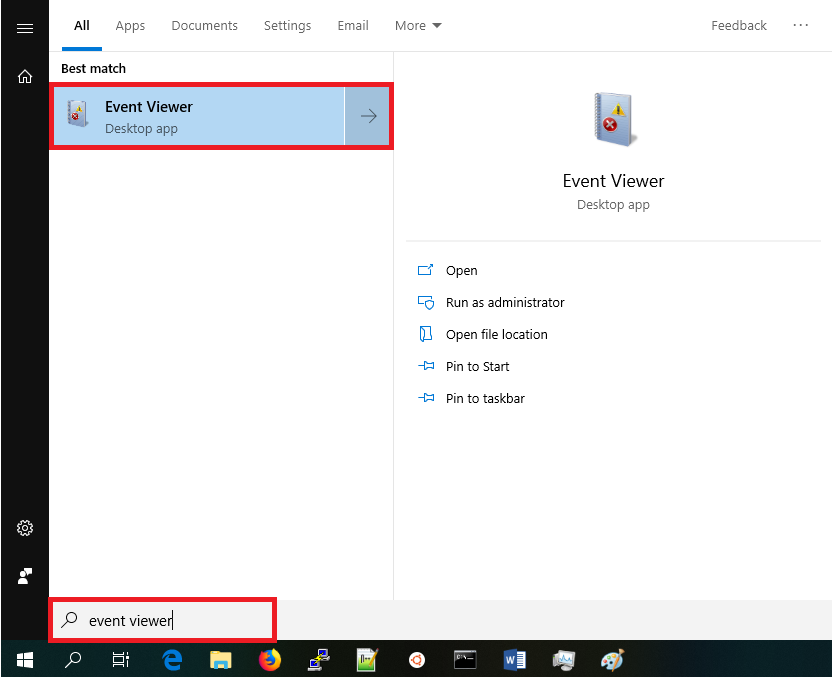
Do you see a specific process here with a high CPU load? Then restart the process and check the log files of the specific process. Don’t see anything in the log files? Then, consult the Windows Event Viewer (the Windows system and application log) by pressing the start button and searching for 'Event Viewer'.
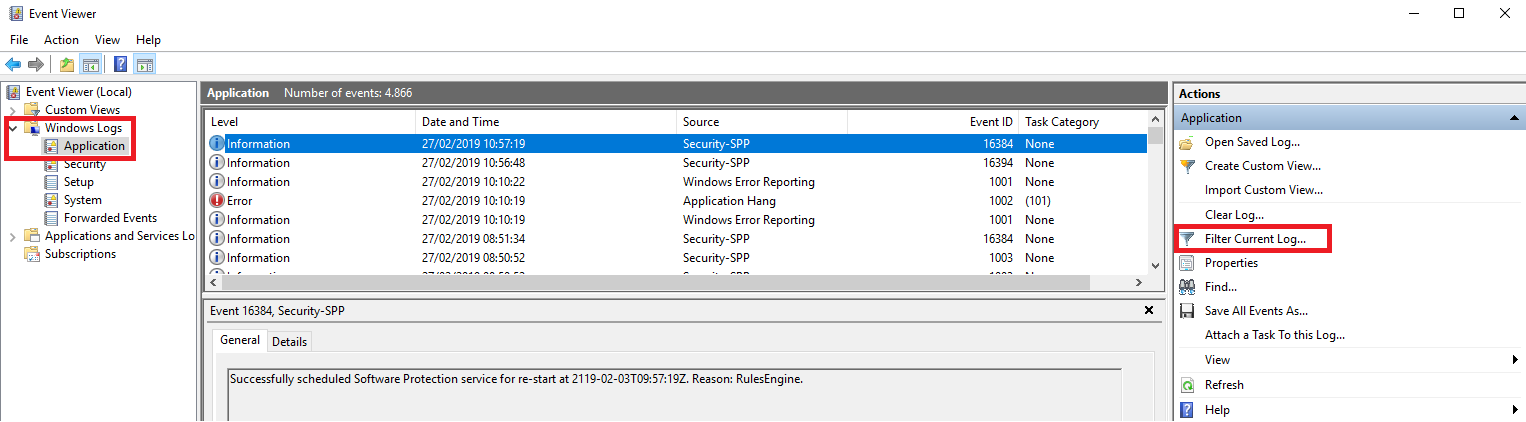
Click 'Windows Logs'> 'Application' in the Event Viewer. For a clearer overview, you can right click 'Filter Current Log' and tick all options except 'Information'.
Errors with a red exclamation mark are especitally interesting to examine (in this screenshot, an error is generated by a stalled process which has been closed from the Task Manager).
This concludes this article on investigating high CPU load. Should you have any questions left regarding this article, or want a second opinion on your investigation, do not hesitate to contact our support department. You can reach them via the ‘Contact Us’ button at the bottom of this page.