Top is a process and resource monitor which is present in all Linux distros by default. You can regard Top as a command-line counterpart of the Windows Task Manager, or the Activity Monitor in MacOS. In this article, we show how Top works.
Starting top
Starting the top is very straight forward and is done via command-line (via SSH orthe VPS console) with the command:
sudo topYou will see an output on your VPS as in the example below.
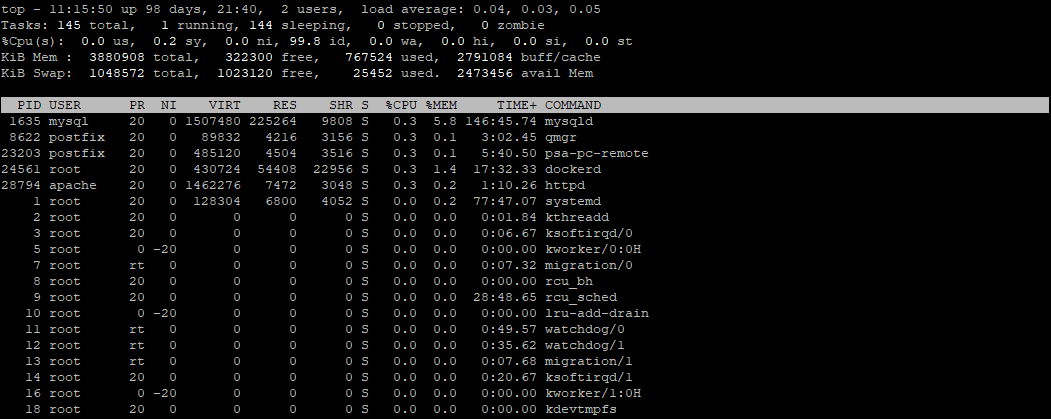
This overview is divided into two parts: the summary part (the top 5 lines) and the task part (from PID, user etc).
Top summary
The upper part of the Top output is the 'summary area' and consists of the following elements:
- system time, uptime, users:
At the top left, you see the system time (which you also see with the 'date' command), how long your server has been up (i.e. without a restart), and the number of user sessions respectively.
The number of user sessions is normally 2: 1 for the system itself and 1 for your SSH connection (to be checked with the 'who' command).
- load average:
Shows the average load of your VPS over one, five and fifteen minutes respectively.
If there is a load of 0.3, this means that 30% of the CPU core (s) is loaded. The limit of this load score is 1 (or 100%) per CPU core, so, for a VPS with 2 cores, a capacity of 1.40 would still have 60% capacity. Do you go over your total limit (e.g. a load of 1.2 by 1 CPU core)? Then, there is 20% more work than the CPU can handle. - Tasks:
You can see the total number of active, running, sleeping, stopped and zombie processes. These mean the following:
- Total: The sum of all running, sleeping, stopped and zombie processes.
- Running(R): The task which is executed by the CPU or is ready to be executed. In Linux, active processes alternate continuously. If a process is active, CPU work is performed. If a process is inactive (idle), I/O work is performed on the hard disk.
- Sleeping: Consists of 'Interruptible Sleep (S)' and 'Uninterruptible Sleep (D)'. Respectively, these are waiting for an event or an I/O operation to be completed.
- Stopped(T): Processes stopped by a job control signal (e.g. ctrl + z).
- Zombie(Z): Processes sometimes create 'child' processes. If they are terminated but the 'parent' process isn’t, then, the data structures of the 'child' processes for the parent remain in the form of a 'zombie' process.
- CPU:
Shows how much CPU usage takes place.
- Us: How much time the CPU spends on user processes.
- sy: How much time the CPU spends on kernel processes.
- ni: Stands for Nice and determines the priority for CPU usage assigned to processes. The ni value shows how much time is spent on processes with a manually set nice value.
- id: The amount of time that the CPU is in idle mode. In general, idle time also means lower power consumption.
- wa: The amount of time the CPU waits for disk I/O (input/output) to finish.
- hi: The time spent on hardware interrupts. This concerns operations of peripheral devices, such as pressing a key on a keyboard.
- si: The time spent on software interrupts. These are the result of specific software instructions which are executed on the processor and processed by your OS.
- st: The amount of CPU time available for virtual machines. This will always be 0 because virtualization is disabled on our VPS platform and therefore you cannot host a VM on your VPS.
- Memory: Show the RAM and Swap usage respectively (Swap memory is a part of your hard disk which is used as virtual RAM if your RAM is almost fully taxed).

- The numbers at 'total', 'free' and 'used' speak for themselves.
- Buff/cache: Your RAM keeps a disk cache (which is emptied if processes need the RAM) where frequently addressed parts of your hard disk (cache) and write actions (buff) are saved.
- avail Mem: The amount of memory available before the swap memory is enabled.
Top Task area
The 'Task area' shows the following information about active processes:
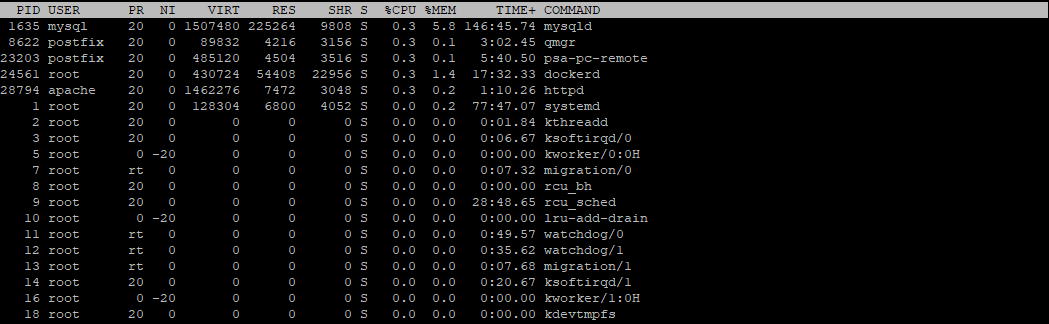
- PID: The process ID, which is a unique number.
- USER: The user who started the process. Most of the processes which you see will automatically start on your OS on behalf of the root user.
- PR: The scheduling priority of the process, as regarded by the Linux kernel.
- NI: Stands for 'nice' and prioritises processes for CPU use. -20 is the highest priority and 19 is the lowest.
- VIRT: The total memory usage by a process and includes the code of the program, RAM and Swap usage.
- RES: The amount of RAM that the process uses.
- SHR: The amount of memory shared with other processes.
- S: The state of a task (see tasks)
- %CPU: Percentage of the processor used (you have 100% per CPU core at your disposal)
- %MEM: Percentage of the total RAM used.
- TIME+: The amount of CPU time (up to the 100th second) used by the process since the process is active.
- COMMAND: The name of the process, this is also often the name of the associated service.
Top commands
Once started, top has a number of commands / key combinations for use:
- Arrow keys & page up/down: Navigate through the displayed list in the Task area.
- q: Finish the top with the q-key.
- shift + p: Sort the processes by CPU usage.
- shift + m: Sort the processes by memory (%MEM) usage.
- shift + t: Sort the processes by running-time.
- shift + n: Sort the processes by process ID.
- t: Changes the display of the CPU usage in the summary section.
- m: Changes the display of memory usage in the summary section.
- shift + r: Sort the processes in ascending order instead of descending (default).
- c: By pressing c, the 'Command' column shows the entire path from which the processes were started.
- shift + v: Shows the parent / child process hierarchy.
- k: Prompts for a process ID and closes the specified process. By default, SIGTERM is used for a graceful shutdown of the process. For a forced shutdown, you use SIGKILL.
This concludes our article on the usage of the Top command in Linux. Should you have any questions left regarding this article, do not hesitate to contact our support department. You can reach them via the ‘ContactUs’ button at the bottom of this page.
If you want to discuss this article with other users, please leave a message under 'Comments'.