In the control panel you can see graphs displaying the average CPU usage of your VPS. Our monitoring systems check CPU usage every 5 minutes on the hyper-visor (the software in which your VPS is running) and therefore these graphs only display an average instead of real-time values.
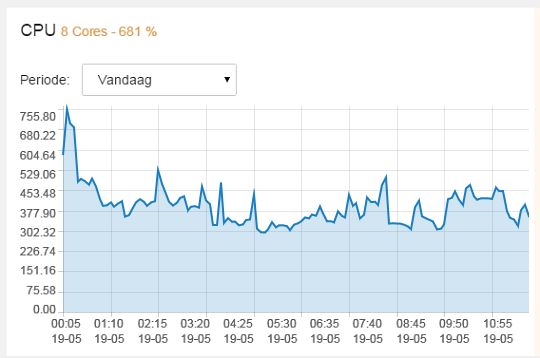
The graphs display a value of 100% for each core, so if your VPS only has one core the maximum usage is 100%. For two cores this is 200%, for four cores 400%, etc.
Because we can only take measurements in the hyper-visor and this is based on an average, the value of CPU usage in your OS itself can vary (for example through the command 'top' for Linux-based server or 'Task Manager' in case of Windows Server).