


Plesk Obsidian (18.0) comes with a new monitoring tool called 'Advanced Monitoring' (powered by Grafana) by default. This allows you to monitor the hardware usage of your VPS. However, two problems can occur with this:
- By default, an option is set where Advanced Monitoring displays a 'memory usage' warning when specific services such as Apache reach 50% RAM usage. The warnings you see may cause some confusion as to whether you're experiencing problems or not.

You will also get this warning if you are not browsing Plesk under Advanced Monitoring.
- RAM usage may be displayed inaccurate under Advanced Monitoring (this has been improved significantly with patches after Obsidian's release).
In this article, we show what you can do if your Plesk server regularly shows the error message '[Alerting] Apache & php-fpm memory usage' and how you see your RAM usage more accurately.
[Alerting] Apache & php-fpm memory usage
By default, Advanced Monitoring in Plesk is set to display a warning when a service such as Apache / PHP-fpm uses 50% of your RAM (we changed this in our images, it was 20%). With an X4 VPS, this means that you will receive a warning with 2GB RAM usage.
Grafana tends to see a higher RAM usage than your server actually uses, which may lead to a false positive. Even on an empty Plesk VPS, you can already see warnings of high RAM usage. You prevent such incorrect error messages as follows:
Step 1
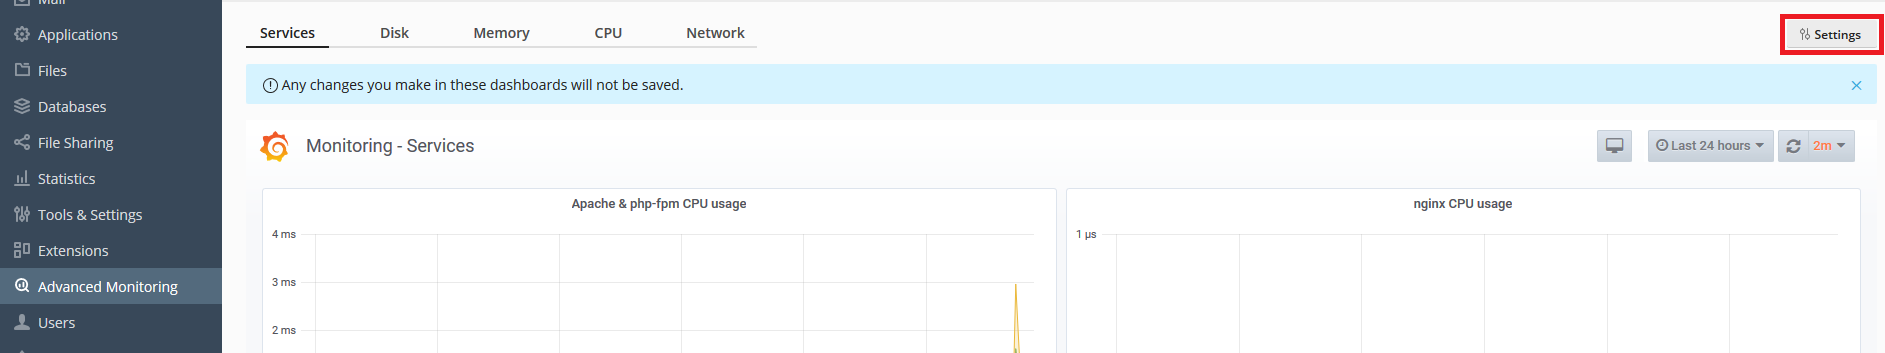
Log in to Plesk and click 'Advanced Monitoring' in the left menu.
Step 2
Click 'Settings' in the overview that appears at the top right.
Step 3
Scroll down to the different memory usage limits that are set. These limits determine when you will see a warning. Disable these options or adjust the percentage to a higher value. After adjusting, click 'Apply' at the very bottom.
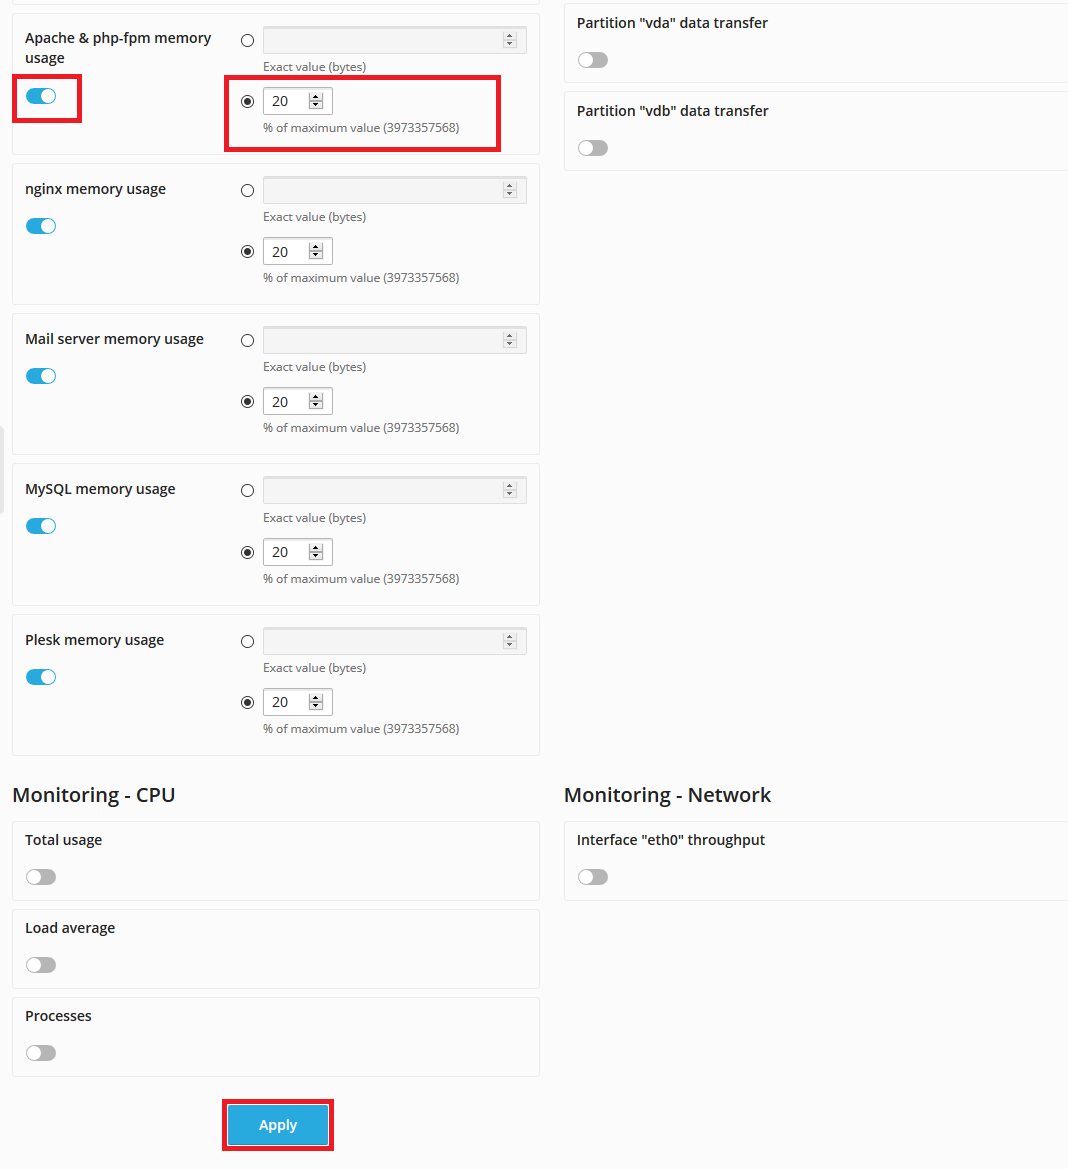
In addition to the settings in the screenshot above, by default, a monitor is set at the top right of the settings to give a warning when using 90% RAM.
Resource usage is displayed inaccurately
The memory usage that Plesk displays under 'Advanced Monitoring' does not always match the actual usage (this has been improved significantly with patches after Obsidian's release). The tool used might not be able to accurately read this on a virtualized platform. You can see a more accurate representation of your memory usage as follows:
Step 1
Connect to your VPS via SSH or the VPS console in the TransIP control panel.
Step 2
Use one of the following commands to show the memory usage:
free -m
    top
For an explanation of the top command, see this article.
Should you have any questions left regarding this article, do not hesitate to contact our support department. You can reach them via the ‘Contact Us’ button at the bottom of this page.